
In the world of statistics, understanding the position and significance of a particular data point within a dataset is crucial. This is where concepts like the Z-score and percentiles come into play. Both are tools that statisticians and researchers use to interpret data, but they offer different perspectives. To understand the relationship between Z-scores and percentiles, we must first understand each concept individually.
What is a Z-score?
The Z-score, often termed as a standard score, measures how many standard deviations a data point (or score) is from the mean of a dataset. It offers a precise position of individual scores by standardizing the entire dataset, providing a clearer picture of how data is spread around the mean.
Z-score formula:
Where:
Z = Z-score
X = Individual data point
μ = Mean of the dataset
σ = Standard deviation of the dataset
Learn about Significance Level Vs. Confidence Level Vs. Confidence Interval
What is a Percentile?
A percentile, on the other hand, indicates the relative standing of a data point within a dataset. For instance, if a score is in the 85th percentile, it means the score is higher than 85% of the other scores in the dataset.
From Z-score to Percentile
Converting a Z-score to a percentile is a common practice, especially when one needs to convey the relative standing of a data point in more intuitive terms. To make this conversion, statisticians often use the standard normal distribution table, commonly known as the Z-table.
The Z-table provides the cumulative probabilities (or percentiles) associated with standard scores. Since the standard normal distribution is symmetrical around the mean (which has a Z-score of 0), a Z-score of 0 corresponds to the 50th percentile. Positive Z-scores will correspond to percentiles greater than 50%, while negative Z-scores will correspond to percentiles less than 50%.
Examples
Example 1:
Imagine a student scores 75 on a national mathematics test. The mean score for this test is 50, with a standard deviation of 10.
First, let’s calculate the Z-score:
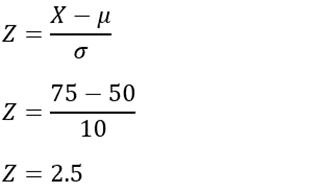
A Z-score of 2.5 indicates that the student’s score is 2.5 standard deviations above the national average. Using the Z-table, this Z-score corresponds roughly to the 99th percentile. This means the student scored higher than approximately 99% of the other test-takers.
Example 2:
Consider an employee who’s ranked 15th in sales out of 100 employees. When the sales rankings are normally distributed with a mean of 50 and a standard deviation of 15, we want to find out where this employee stands in terms of Z-score and percentile.
Using the formula:
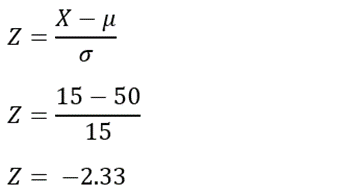
The negative Z-score indicates the employee’s sales rank is below the mean. Consulting the Z-table for a Z-score of -2.33, we find a percentile of approximately 1%. This means the employee’s sales rank is higher than only about 1% of the other employees, suggesting they might need additional support or training.
Importance of Z-score to Percentile Conversion
Converting Z-scores to percentiles (and vice versa) is crucial in many areas:
- Academia: Standardized tests like the SAT or GRE provide scores in percentiles, helping students understand their relative standing compared to others.
- Medicine: Growth charts use percentiles to track a child’s growth compared to national or regional averages.
- Business: Companies might assess employees’ performances using percentiles to understand their relative contributions within departments.
Summary
Z-scores and percentiles are interconnected tools that transform raw scores into meaningful insights. While Z-scores give us a clear picture of a data point’s relation to the mean, percentiles help place this data point in the broader context of the entire dataset. By understanding how to move between these two metrics, professionals across sectors can make informed decisions, whether they’re evaluating test scores, employee performances, or patient health metrics. In essence, the conversion from Z-score to percentile allows for a richer, more nuanced understanding of data and its implications.
