Category: Confidence Intervals

Significance Level Vs. Confidence Level Vs. Confidence Interval

While many assume statistics is a science, it really isn’t. After all, you probably already know that many terms are open to interpretation not to mention that many words mean the same thing such as man and average. But there are others that may appear to be the same and can be quite different such as significance level and confidence level. 

Find your z score values.

significance-level

Although they may sound the same, the truth is that significance level and confidence level are in fact two completely different concepts. On the other hand, confidence levels and confidence intervals also sound like they are related. They are usually used in conjunction with each other, which adds to the confusion. However, they do have very different meanings.

Simply put:

#1: Significance Level: 

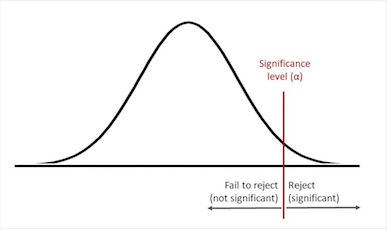
In a hypothesis test, the significance level, alpha, is the probability of making the wrong decision when the null hypothesis is true.

#2: Confidence Level: 

The probability that if a poll/test/survey were repeated over and over again, the results obtained would be the same. A confidence level = 1 – alpha. 

#3: Confidence Interval: 

A range of results from a poll, experiment, or survey that would be expected to contain the population parameter of interest. For example, an average response. Confidence intervals are constructed using significance levels/confidence levels.

Learn more about confidence intervals. 

Confidence Level Vs. Confidence Interval

Confidence-Level-Vs.-Confidence-Interval

When a confidence interval (CI) and confidence level (CL) are put together, the result is a statistically sound spread of data. For example, let’s assume a result might be reported as “50% ± 6%, with a 95% confidence”. This is the same as saying:

  • The confidence interval: 50% ± 6% = 44% to 56%
  • The confidence level: 95%

As you can see, confidence intervals are intrinsically connected to confidence levels which are expressed as a percentage (for example, a 90% confidence level). 

What is statistical significance?

Confidence intervals are a range of results where you would expect the true value to appear. For example, you survey a group of children to see how many in-app purchases made a year. Your test is at the 99 percent confidence level and the result is a confidence interval of (250,300). That means you think they buy between 250 and 300 in-app items a year, and you’re confident that should the survey be repeated, 99% of the time the results will be the same. 

Confidence Level Vs. Significance Level

Confidence-Level-Vs.-Significance-Level

In essence, confidence levels deal with repeatability. On the other hand, significance levels have nothing at all to do with repeatability. Instead, they are set at the beginning of a specific type of experiment (a “hypothesis test”), and controlled by you, the researcher.

The significance level which is also called the alpha level is a term used to test a hypothesis. More specifically, it’s the probability of making the wrong decision when the null hypothesis is true.  In statistical terms, another way of saying this is that it’s your probability of making a Type I error. 

Understanding the standard deviation.

Constructing Confidence Intervals With Significance Levels

Constructing-Confidence-Intervals-With-Significance-Levels

Using the normal distribution, you can create a confidence interval for any significance level with this formula:

sample statistic ± z*(standard error)

(z* = multiplier)

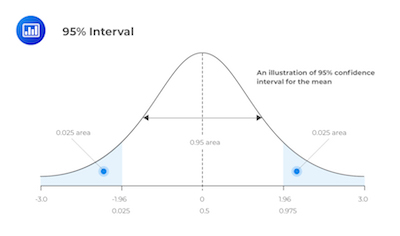
Confidence intervals are constructed around a point estimate like the mean using a statistical table such as the z-table or t-table, which give known ranges for normally distributed data. Normally distributed data is preferable because the data tends to behave in a known way, with a certain percentage of data falling a certain distance from the mean. For example, a point estimate will fall within 1.96 standard deviations about 95% of the time.

What Is A Confidence Interval?

In statistics, a confidence interval refers to the probability of a population parameter fall between a set of values for a certain proportion of times. 

Generally speaking, a confidence interval measures the degree of certainty or uncertainty in a sampling method.

confidence-interval

Learn more about the Z-score.

Notice that they can take any number of probability limits. However, the most common ones are 95% and 99%. 

Understanding A Confidence Interval

Understanding-A-Confidence-Interval

Simply put, statisticians use a confidence interval when they want to measure uncertainty in a sample variable. Let’s say that a researcher chooses different samples randomly from the same population. He then needs to compute a confidence interval for each sample to see how it may represent the true value of the population variable. 

One of the things you need to keep in mind is that a confidence interval is a range of values that are bounded both above and below the mean. So, we then state that it refers to the percentage of probability or certainty that the confidence interval would contain the true population parameter when you draw a random sample many times. 

What Is Descriptive Analysis?

How To Calculate A Confidence Interval

How-To-Calculate-A-Confidence-Interval

Imagine that a group of researchers is studying the heights of college basketball players. They take a random sample from the population and establish 74 inches as the mean height. 

Notice that the average of 74 inches on its own is of limited use since it doesn’t reveal the uncertainty linked with the estimate. So, you are missing the degree of uncertainty. 

Ultimately, confidence intervals do provide more information than simple point estimates. When you establish a 95% confidence interval using the sample’s mean and standard deviation, and assuming a normal distribution as represented by the bell curve, the researchers arrive at an upper and lower bound that contains the true mean 95% of the time.

Getting back to our example, imagine that the interval is between 72 inches and 76 inches. If the researchers take 100 random samples from the population of college basketball players as a whole, the mean should fall between 72 and 76 inches in 95 of those samples.

Understanding the F distribution.

Examples Of A Confidence Interval

Examples-Of-A-Confidence-Interval

It’s always important for a researcher to look at the confidence interval. After all, when a researcher wants more confidence, he can simply expand the interval to 99%, for example. When he does this, he is basically creating more room for a greater number of sample means. So, in our example, if they establish a 99% confidence interval as being between 70 inches and 78 inches, they can then expect to have 99 out of 100 samples evaluated to contain a mean value between these numbers. 

Discover what to do when you can’t run the ideal analysis.

On the other hand, if they were using a 90% confidence interval, this would mean that they could only expect 90% of the interval estimates to include the population parameter. 

One of the things that is important to retain about confidence intervals is that they don’t represent a percentage of data from a given sample that falls between the upper and lower bounds.