Category: Regression

A Brief Introduction To Regression Analysis

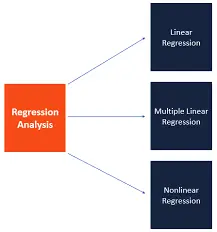
If you just began studying statistics, one of the first concepts that you will learn is regression analysis. 

Discover everything you need to know about the z-score tables.

What Is Regression?

regression-analysis

Simply put, a regression is just a mathematical relationship between a dependent variable or the outcome and the independent variables which are called predictors. 

The real relationship needs to be calculated based on the effect that these predictors have. 

Let’s imagine that you are looking to determine if the time of day has a significant impact on the purchase of a snack. You could map your model the following way:

Number of Snacks purchased = b0+ b1(Time of Day) + ε

Looking At The Variables

In this example, we are interested in the number of snacks. So, this will be your continuous variable since it is a range of real numbers that can range to infinity. The predictor variable is the time of day, and once again, it’s a continuous variable.

Discover what is a confidence interval.

The Other Stuff

When you look at the equation we created for the model, there are still some factors that you need to understand:

b0 = the intercept and it is interpreted as the prediction when the predictor is zero. In our example, it would be the number of snacks sold when the time of day is 00:00 hours.

b1 = actual relationship between the snacks sold and the time of day. 

ε = represents the error that is always present in a regression. For example, some people will buy snacks for a variety of reasons other than the time of day. If the sample is truly random, ε takes those natural errors into account.

Looking to know more about the standard deviation?

Simple Regression

When you are performing a simple regression, this means that you are only looking at the relationships between a single predictor and a single outcome. When you are looking at this relationship, you should look at a plot of the data first:

Simple-Regression-plot

These blue dots that you see in the image above represent the data in the form of Cartesian points. 

To calculate the intercept and coefficient, you need to use the following equation:

Simple-Regression-equation

Where:

b = represents the intercept and it measures the variance of each data (numerator) compared to the variance of the data set that is the product of the two data sets.

a = represents the effect of the difference between X and Y based on the sample size. 

Learn how to do a simple regression analysis.

Multiple Regression

Multiple-Regression

When you’re looking at regression analysis, you have not only the simple regression but the multiple regression as well. 

As w already mentioned above, there’s certainly a lot more factors rather than just the time of the day that affects the purchase of snacks. So, in these cases, we need to use multiple regression since it takes into account that the predictors may also affect one another. The general model for multiple linear regression is:

Y = b0 + b1X1 + b2X2 + … + bnXn

Multiple linear regression takes into account that multiple variables not only affect the outcome but also affect one another. It is even possible to have two or more variables that interact with each other.

How To Do A Simple Regression Analysis

When you first start learning statistics, one of the first concepts that you will learn is the simple regression. 

The reality is that when you have data, it simply begs to be analyzed. After all, this is how you can find patterns. On most occasions, you will need to start with a graph and some type of linear regression. But when you finally have the equation, then it’s time to move onto the simple regression analysis.

Make sure to use our z-score calculator.

Understanding The Simple Regression Analysis

Simply put, simple regression analysis refers to the interpretation and use of the regression equation. So, in case you don’t remember, this is the regression equation: 

simple-regression-analysis

Where,

Yi = the dependent variable which is the outcome or effect that you are interested in.

Xi = the independent variable which is the variable that you believe predicts the outcome.

b1 = the relationship between the independent and the dependent variables. 

b0 = means that if the independent variable is equal to zero, then the dependent variable will be equal to b0. 

εi = the term of error or, as it is also called, the range of wrongness linked with your equation. 

Putting The Formula To Work

chart-image

As you can see in the image above, there is a line and a lot of dots around it. Ultimately, each one of the dots you see represents a data point with an independent and dependent value. 

Understanding the normal distribution. 

The line is drawn by solving the following equation:

equation

It’s important to notice that this line rarely is a perfect fit for all the data you have. In case it was, then we can then state that all data points were able to form the line by themselves. 

Simple Regression Analysis Conclusions

One of the things that you need to keep in mind when you calculate the regression analysis for your data set is that you need to also calculate the correlation coefficient. 

Notice that the correlation coefficient always has a value between -1 and +1 and it represents the strength of the regression equation to predict the outcome. 

The closer the correlation coefficient is to 1 (either negative or positive), the stronger the relationship, with 1 being a perfect prediction. The formula is:

correlation-formula

Notice that the correlation coefficient isn’t the same as the coefficient of determination. Simply put, this last one is more explanatory. After all, it can tell you how much of the variability in the outcome is due to the variability in the predictor. 

Learn how to calculate sample size estimates.

When you have a high coefficient of determination, this means that most of the variance of the model can be explained by the dependent and independent variables. On the other hand, when you have a low coefficient of determination, it means that there is a lot of variance that the model can’t explain on its own. 

Discover more about fixed vs random factors in mixed moldes. 

Bottom Line

As you can see, it’s not difficult to understand the simple regression analysis concept. This is because it is one of the first statistic concepts that you will learn when studying statistics.