
Statistics is a realm that offers tools and techniques to decipher the stories that numbers tell. One such tool, embedded deep within the world of statistics and often considered indispensable by researchers and analysts, is the Z-score table. Specifically, the positive Z-score table is an integral resource used in many statistical applications. Let’s delve into its intricacies and understand its significance.
Introduction to Z-Score
Before diving into the positive Z-score table, it’s essential to grasp what a Z-score is. A Z-score, or standard score, quantifies how many standard deviations a particular data point is away from the mean in a dataset. It’s a way to standardize data points within a distribution, making it easier to determine their relative positions.
The formula for calculating the Z-score is:
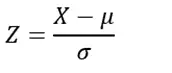
Where:
- Z = Z-score
- X = Individual data point
- μ = Mean of the dataset
- σ = Standard deviation of the dataset
Positive Z-scores indicate that the data point is above the mean, while negative Z-scores suggest the data point is below the mean.
Check out our z-score calculator
The Positive Z-Score Table
Often referred to as the standard normal table or the Z-table, the positive Z-score table provides the probability that a randomly taken data point is less than a given data point in a standard normal distribution (a distribution with a mean of 0 and standard deviation of 1).
Since the standard normal distribution is symmetrical around the mean, the table usually only provides values for positive Z-scores. By understanding the symmetry, one can infer values for negative Z-scores.
Each entry in the positive Z-score table denotes the probability or area to the left of that particular Z-score. This area corresponds to the percentile rank of that score in the distribution.
Interpreting the Positive Z-Score Table
The positive Z-score table is structured with Z-scores running vertically and horizontally. Typically, the vertical column represents the tenths place and the hundredths place of the Z-score, while the horizontal row represents the thousandths place.
For example, to find the area associated with a Z-score of 1.23:
1. Locate 1.2 in the vertical column.
2. Locate 0.03 in the horizontal row.
3. Find the intersection of the row and column. This value represents the cumulative probability up to the Z-score of 1.23.
Applications and Examples
Example 1: Suppose a college entrance exam has a mean score of 500 and a standard deviation of 100. If a student scores 650, we can use the positive Z-score table to determine the student’s percentile rank.
First, we calculate the Z-score:
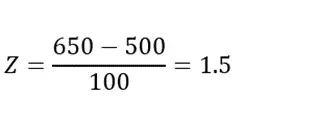
Using the positive Z-score table, a Z-score of 1.5 corresponds roughly to the 93rd percentile. Thus, the student scored higher than approximately 93% of the exam takers.
Example 2: In a manufacturing unit, the length of a component follows a normal distribution with a mean of 10 cm and a standard deviation of 0.5 cm. If the acceptable length is above 10.8 cm, what proportion of the manufactured components are acceptable?
First, find the Z-score:
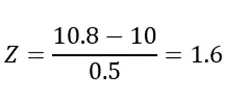
Consulting the positive Z-score table, 1.6 corresponds to approximately the 95th percentile. This means only about 5% of the components have lengths above 10.8 cm and are considered acceptable.
Discover everything you need to know about the Z table.
Summary
The positive Z-score table serves as a bridge, translating raw Z-scores into meaningful percentiles. This translation aids in understanding the relative position of a data point within a distribution. Whether it’s determining a student’s standing in an exam or gauging the quality of industrial components, the positive Z-score table’s applications are vast and varied.
While technology and software have made it easy to compute these values without manually referring to the table, understanding its foundational logic is crucial for anyone delving into statistics. This table encapsulates the essence of the normal distribution and offers insights that are fundamental to the world of data interpretation. As with many statistical tools, while its form might seem simple, its applications and implications in real-world scenarios are profound.
