
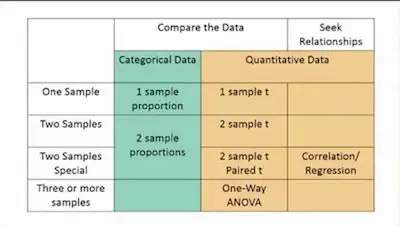
When you are studying statistics for the first time, you probably already realized that there is a wide range of statistical tests that you can perform. So, how can you know which statistical test you should conduct at any given time?
Null Hypothesis And Testing
Before we actually get into the different statistical tests and when you should use each one of them, we believe that it is important that you know what a null hypothesis is.
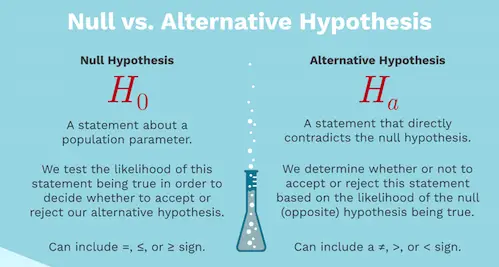
Simply put, a null hypothesis assumes that no significant difference exists in a set of given observations. So, overall speaking, no matter the test you are performing, you will have:
Null Hypothesis: Given two sample means are equal
Alternate Hypothesis: Given two sample means are not equal.
So, when you want to reject the null hypothesis, you will need to calculate the test statistic which will be then compared with a critical value. If it is then found to be greater than the critical value the hypothesis is rejected.
Discover how to do a simple regression analysis.
Critical Value
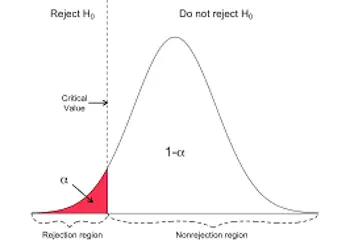
Simply put, the critical value is a point or points on the scale of the test statistic beyond which you reject the null hypothesis. Ultimately, this value comes from the level of significance α of the test.
Putting in other words, the critical value tells you the probability of two sample means belonging to the same distribution.
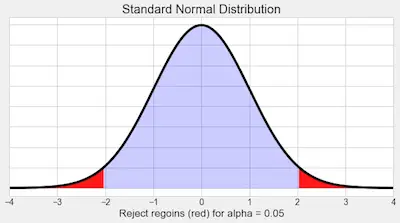
The general critical value for a two-tailed test is 1.96, which is based on the fact that 95% of the area of a normal distribution is within 1.96 standard deviations of the mean.
Relationship Between P-Value, Critical Value, And Test Statistic
As we already mentioned above, the critical value is a point beyond which you reject the null hypothesis. On the other hand, the P-value is defined as the probability to the right of the respective statistic (Z, T, or chi).
The benefit of using p-value is that it calculates a probability estimate, we can test at any desired level of significance by comparing this probability directly with the significance level.
Assume that you have a z-value of 1.67 for an experiment you are conducting. But this value is greater than the critical value at 5% which is 1.64.
However, if you calculate the p-value for 1.67 it comes to be 0.047. You can use this p-value to reject the hypothesis at 5% significance level since 0.047 < 0.05.
Z-Test
In a z-test, the sample is assumed to be normally distributed. A z-score is calculated with population parameters such as “population mean” and “population standard deviation” and is used to validate a hypothesis that the sample drawn belongs to the same population.
Null Hypothesis: Sample mean is the same as the population mean
Alternate Hypothesis: Sample mean is not the same as the population mean
The statistics used for this hypothesis testing is called z-statistic, the score for which is calculated as:
z = (x — μ) / (σ / √n)
where,
x= sample mean
μ = population mean
σ / √n = population standard deviation
If the test statistic is lower than the critical value, accept the hypothesis or else reject the hypothesis
T-Test
A t-test is used to compare the mean of two given samples.
Like a z-test, a t-test also assumes a normal distribution of the sample. A t-test is used when the population parameters (mean and standard deviation) are not known.
There are three versions of t-test:
1. Independent samples t-test which compares mean for two groups
2. Paired sample t-test which compares means from the same group at different times
3. One sample t-test which tests the mean of a single group against a known mean.
The statistic for this hypothesis testing is called t-statistic, the score for which is calculated as
t = (x1 — x2) / (σ / √n1 + σ / √n2)
where,
x1 = mean of sample 1
x2 = mean of sample 2
n1 = size of sample 1
n2 = size of sample 2