Category: Model Building

Calculating Sample Size Estimates – The Effect Size

There’s no question that some parts of running models are easier than others. And when talking about complexity or difficulty, we have to mention the effect size when you are calculating sample size estimates. 

One of the things that you may not know is that the power of every significance test is based on four things: the alpha level, the size of the effect, the amount of variation in the data, and the sample size.

Discover how you can use z score tables.

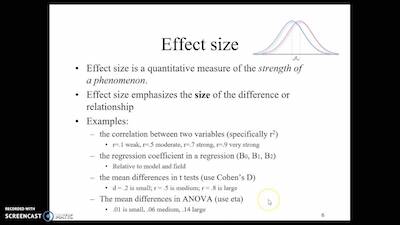
The truth is that the effect size in question needs to be measured in a different way, depending on the statistical test that you are conducting. It could be a mean difference, a difference in proportions, a correlation, regression slope, odds ratio, etc.

the effect size

Notice that when you need to study and estimate the sample size needed for a specific power, you usually can’t change the alpha level. If you think about it, it is usually set at 0.05 for most purposes. Besides, you can lower the amount of variation by changing the design of the study or including a key covariate, if one is available. 

Looking to know more about descriptive analysis?

In what concerns the effects on the effect size, you all you can do is to measure the variables with as little error as possible. And this is why we solve for sample size. 

As a rule of thumb, even the tiniest effect size cane be found statistically significant with a large enough sample. But while this seems ok, the truth is that you don’t want to make any claims that an effect exists even if it’s tiny. So, just keep in mind that good power calculations are based on the smallest effect that is scientifically or clinically meaningful.

Discover how to apply the z score in real life.

Why Is It Hard To Find The Effect Size?

how to use the effect size

The truth is that choosing the smallest scientifically meaningful effect may be very difficult to figure out before out. And there are two main reasons. The first is the fact that some scales are pretty meaningless. Effects that are measured in degrees Celsius, hours, or currencies are usually easy for you to understand since they are meaningful and concrete. However, you need to think about what the general public actually understands and what find meaningful. For example, the general public may not realize that a rise in 0.5 degrees Celsius in the temperature of a soil core under experimental conditions is meaningful. 

And this is why it’s the one step that you need to take on your own without any help. After all, it’s on those scales that are abstract and lack inherent meaning and that haven’t been used much for which the smallest meaningful effect size is difficult to define. 

The second reason because it’s hard to determine the effect size is related to the fact that it needs to make sense to you. 

Get a complete grasp about the z score, z table, and z distributions.

Bottom Line

effect size chart

Depending on how you define and think about your effect, it can be tricky to translate it to the effect size the software wants you to input.

And once you estimate sample sizes, remember they’re just estimates. They’re only as good as the information they’re based on. If you have to guess a bit here and there, don’t take them too seriously.

Fixed Vs Random Factors In Mixed Models

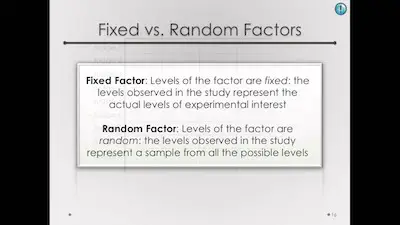
When you are studying or running mixed models, then you need to be aware that you will need to keep in mind the clear distinction between fixed vs random factors. The reality is that establishing this difference between fixed vs random factors and determine which factors are fixed and which ones are random is very important since this is the only way to get an accurate analysis. 

Discover everything you need to know about the z score and the z table.

fixed vs random factors

One of the things that you may have already noticed is that most textbooks don’t take a good look at these factors and you may experience some problems to specify factors as fixed and random. Besides, it is also important to notice that the same factor can be considered fixed or random, depending on the objective. 

Fixed Factors

The best way to think about fixed factors is in terms of differences. So, you can then state that the effect of a categorical fixed factor can be defined by differences from the overall mean. On the other hand, the effect of a continuous fixed factor which is usually called covariate can be defined by its slope. So, how the mean of the dependent variable differs with differing values of the factor. 

We can then state that the output of fixed factors estimates for slopes or mean-differences. 

These are the statistical analysis rules that you should forget about.

Random Factors

As you can easily understand, random factors are defined by a distribution and not by differences. Ultimately, the values of a random factor are assumed to be picked from a population with a normal distribution with a certain variance. 

What is statistical significance?

Situations That Indicate Fixed Factors

Fixed Factors
  • The factor is the primary treatment that the researcher wants to compare
  • The factor is a secondary control variable, and the researcher wants to control for differences in this factor. 
  • The factor has only two values.Even if everything else indicates that a factor should be random, if it has only two values, the variance cannot be calculated, and it should be fixed.

Discover everything you need to understand the standard deviation.

Situations That Indicate Random Factors

random factors
  • The researcher is interested in quantifying how much of the overall variation to attribute to this factor. 
  • The researcher is not interested in knowing which means differ but wants to account for the variation in this factor. 
  • The researcher would like to generalize the conclusions about this factor to the whole population.
  • Any interaction with a random factor is also random.

Bottom Line

Hopefully, you now have a better understanding about the difference between fixed vs random factors. While this is not hard, the truth is that this difference isn’t well stated among most textbooks and this is why so many statistics students experience difficulties in this subject. 

As a last note, it is important to keep in mind that how the factors of a model are specified can have great influence on the results of the analysis and on the conclusions drawn.

5 Benefits Of Running Repeated Measures ANOVA As A Mixed Model

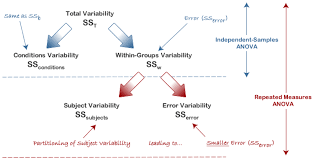
When you are looking to running repeated measures ANOVA, then you probably already know that you have two different options. The traditional approach consists of treating it as a multivariate test-each response that is considered a separate variable. The other way is to use a mixed model. 

Looking to calculate the z score?

Notice that while the multivariate approach is quite intuitive as well as it is easy to run, there are benefits of running repeated measures ANOVA as a mixed model. 

5 Benefits Of Running Repeated Measures ANOVA As A Mixed Model

running repeated measures ANOVA

#1: Missing Data:

The reality is that when you are using the default approach, you will see that you will need to drop any observation with any missing data on any variable that is involved in the analysis. 

So, when the percentage that is missing is small and the missing data are a random sample of the data set, this is a more reasonable approach.  

On the other hand, when you are using the multivariate approach, if a child is missing at one point, they will be dropped from the entire analysis. In the mixed approach, only that time point will be dropped. The rest of the data will be retained. 

Understanding the Z score, Z table, and Z transformations.

#2: Post Hoc Tests:

Post Hoc Tests

As you probably already know, the sums of squares are calculated using a multivariate approach. So, post-hoc tests aren’t available for repeated measures factors. While they are available, they are only available when you are using a mixed approach. 

#3: Flexibility in Treating Time As Continuous:

Depending on the study that you are conducting, instead of considering time as 4 categories, you can treat time as a continuous variable to be more accurate. Ultimately, this will allow you to model a regression line for time instead of simply estimating 4 means. 

While this isn’t possible in the multivariate approach, it is very easy to achieve in the mixed approach. 

#4: A Single Dependent Variable Can Be Used In Other Analysis:

A Single Dependent Variable Can Be Used In Other Analysis

Let’s say that you have a two-factor (2X4) repeated measures design and that you want to study whether the impact of these 2 factors on an outcome was mediated by a third variable. 

Each subject has 8 values of the mediator (one for each of the conditions) and 8 values on the final outcome. The truth is that the mediator is both an outcome and a predictor variable in 2 different models. So, you need to have a single outcome variable and not 8 to ensure that you have a single path coefficient between the mediator and the outcome. 

These are the most common probability distributions.

#5: Easier To Build Into Larger Mixed Models:

In some cases or in some studies that you may need to conduct, you may be required to change a two to a three model. And this is simpler when the model is already set up as a mixed model.  

Bottom Line

As you can see, running repeated measures ANOVA as a mixed model has many different benefits. However, it pays to be careful since you may not be able to apply it to all your studies. 

6 Guidelines For Accurate Statistical Model Building

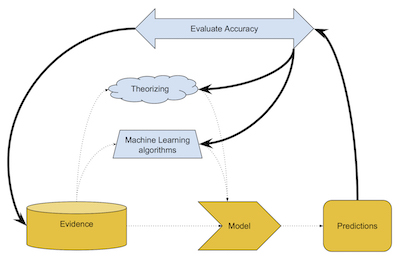
When you are learning statistics, then you may not have the idea that actually teaching how to do accurate statistical model building is one of the most difficult tasks. The truth is that when you are learning how to do an accurate statistical model building, you will notice that this is a process that is difficult to divide into steps. And even if you can, you need to, at each step. evaluate the situation and make decisions on the next step. 

Take a look at our Z-score calculator.

accurate statistical model building

The reality is that you shouldn’t run into difficulties when you are looking at predictive models when the relationships between the variables aren’t a concern. In this situation, you can simply run a regression model. However, when you are trying to establish the relationships between variables, then you may struggle a bit. So, make sure that you take a look at the following guidelines on how to do an accurate statistical model building.

6 Guidelines For Accurate Statistical Model Building

#1: Keep In Mind That Regression Coefficients Are Marginal Results:

So, simply put, you just need to remember that the coefficient for each predictor is the unique effect that this same predictor has on the response variable. Ultimately, it is the effect after controlling for other variables in the model. 

Discover what to do when you can’t run an ideal analysis.

#2: Begin With Univariate Descriptives And Graphs:

Begin With Univariate Descriptives And Graphs

No matter what data you are running, it is extremely important that you always start with descriptive analysis. After all, this is extremely handy to find errors that you may have missed during cleaning. Besides, you should take a moment for graphs as well. The reality is that you shouldn’t only be looking for bell curves. You should also be looking for interesting breaks in the middle of the distribution. From values that are much higher or with less variation than you expected to values with a huge number of points.

#3: Run Bivariate Descriptives Including Graphs:

Again, charts may be extremely helpful especially scatterplots. The reality is that you need to try to understand how each potential predictor relates not only on its own but also to every other predictor and to the outcome as well. 

What is statistical significance?

#4: Place Predictors Into Perspective:

Place Predictors Into Perspective

One of the best things that you can consider doing is to set up your predictors into perspective or in sets if you prefer. This is a helpful way to see how related variables work together as well as to see what happens to them once you put them together.

One of the things that you may not know is that in most cases, the variables within a set are correlated. However, when you put them all at once, you may have a hard time discovering their relationships. 

These are the most common probability distributions.

#5: Model Building And Interpreting Results Go Hand-In-Hand:

Model Building And Interpreting Results Go Hand-In-Hand

When you run a model, you get a story. So, you just need to listen to it. This way, you will be able to make better decisions on the next model that you have to run. 

#6: A Variable Involved In An Interaction Must be In The Model By Itself:

Finally, it is usually a good idea to simply eliminate non-significant interactions. On the other hand, when you find significant interactions, you have got to maintain them.