
In the world of statistics, understanding the distribution of data points is crucial. Among the various tools used to make sense of these distributions, Z-scores are incredibly pivotal. While both positive and negative Z-scores provide insights into the positioning of data points, the negative Z-score table specifically helps us interpret those data points that fall below the mean. To fully appreciate the significance of the negative Z-score table, we must first journey into the broader landscape of Z-scores and standard normal distributions.
Z-Score Basics
At its core, a Z-score is a statistical measurement that describes a value’s relationship to the mean of a group of values. It’s expressed in terms of standard deviations from the mean. The formula for the Z-score is:
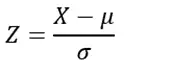
Where:
- Z = Z-score
- X = Individual data point
- μ = Mean of the dataset
- σ = Standard deviation of the dataset
A negative Z-score indicates that the data point is below the mean. The farther away the Z-score is from zero, the more unusual and significant that data point is, relative to the mean.
Read about Positive Z-Score Table
The Standard Normal Distribution and Negative Z-Scores
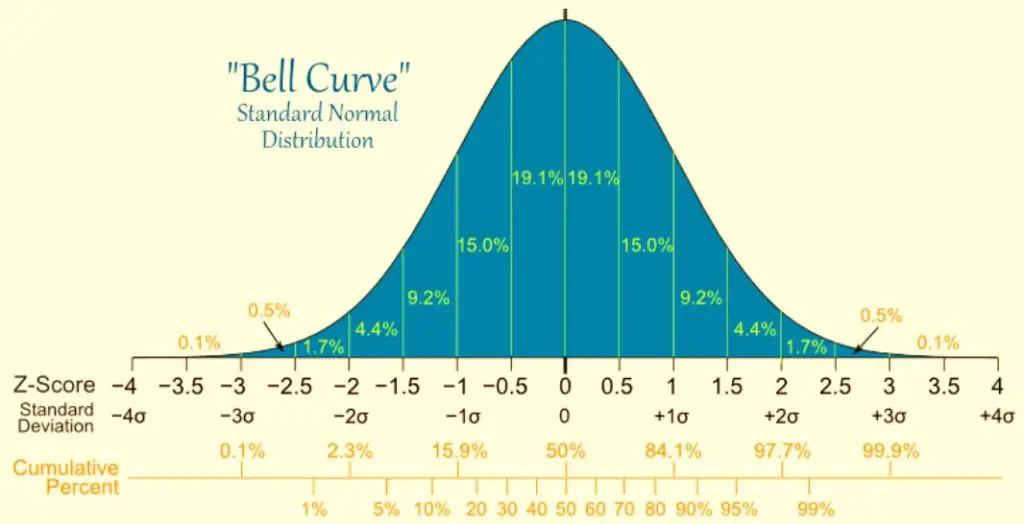
The standard normal distribution, often visualized as a bell curve, is symmetric about the mean. The mean value of the standard normal distribution is zero, which divides the distribution into two halves. While the right half (positive side) represents positive Z-scores, the left half symbolizes negative Z-scores.
When we discuss the negative Z-score table, we’re focusing on this left half, exploring the probabilities associated with data points that fall below the mean.
Diving into the Negative Z-Score Table
Much like its positive counterpart, the negative Z-score table provides probabilities corresponding to various Z-scores. However, given the symmetry of the standard normal distribution, many tables list only positive Z-scores, expecting the user to infer the corresponding negative values. Some comprehensive tables, though, provide explicit entries for negative Z-scores.
Reading a negative Z-score table is straightforward. The table lists Z-scores and their corresponding probabilities. The value found at the intersection of a specific row and column provides the cumulative probability up to that Z-score.
Examples and Applications
Example 1: Let’s say students’ scores in a particular examination are normally distributed with a mean of 50 and a standard deviation of 10. If a student scores 40, we can use the negative Z-score table to determine their percentile rank.
First, calculate the Z-score:
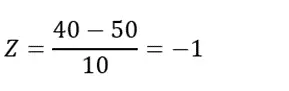
Using the negative Z-score table, a Z-score of -1 corresponds roughly to the 16th percentile. This means the student scored higher than only about 16% of the examinees.
Example 2: In a factory, the diameters of a particular product are normally distributed with a mean diameter of 5 cm and a standard deviation of 0.2 cm. If products below 4.8 cm in diameter are deemed substandard, what proportion of products is substandard?
First, derive the Z-score:
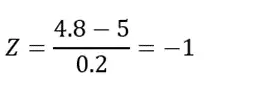
Referring to the negative Z-score table, a Z-score of -1 again aligns with approximately the 16th percentile. This suggests that 16% of the products might be substandard based on the diameter criterion.
Importance of the Negative Z-Score Table
- Scientific Research: In fields like psychology or medicine, the negative Z-score table helps researchers understand how certain data points compare to typical or average outcomes.
- Business Analytics: For businesses, understanding negative Z-scores can be crucial when assessing below-average performance, whether in sales, production quality, or other metrics.
- Academic Evaluation: Teachers can use the negative Z-score table to understand how students perform relative to class or school averages, aiding targeted support.
Check out everything you need to know about the Z table
Summary
The negative Z-score table offers a focused lens into the realm of data points that fall below the mean in a standard normal distribution. While it’s easy to get absorbed by the table’s rows and columns, it’s essential to remember the broader narrative. Each Z-score and corresponding percentile paints a story, positioning data points within a larger dataset and offering context.
Statistics, with its vast methodologies and tools, provides us the means to make sense of data. Among these tools, the negative Z-score table stands as an unsung hero, guiding researchers, analysts, and professionals in interpreting and responding to data points on the left side of the bell curve. Whether you’re in academia, business, or any other field that relies on data, understanding the nuances of the negative Z-score table is undoubtedly a valuable skill.
