
The world of statistics is full of tools, techniques, and terminologies that help us navigate the vast seas of data and draw meaningful conclusions. Among the plethora of statistical terms, ‘critical Z-values’ stands out, especially when venturing into the domain of hypothesis testing. To comprehend the importance and application of critical Z-values, let’s dive deeper into its essence and workings.
Z-Values: A Brief Refresher
At its foundation, a Z-value, or Z-score, indicates how many standard deviations a data point is away from the mean in a given dataset. This score can be both positive and negative, denoting values above or below the mean, respectively.
Discover how to calculate the z-score
What Are Critical Z-Values?
Critical Z-values, often termed critical values, are threshold values set on a standard normal distribution curve. These values, usually one on the left (negative) and one on the right (positive), effectively create a boundary or region. When testing hypotheses, if your test statistic falls within this region, you would reject the null hypothesis in favor of the alternative hypothesis.
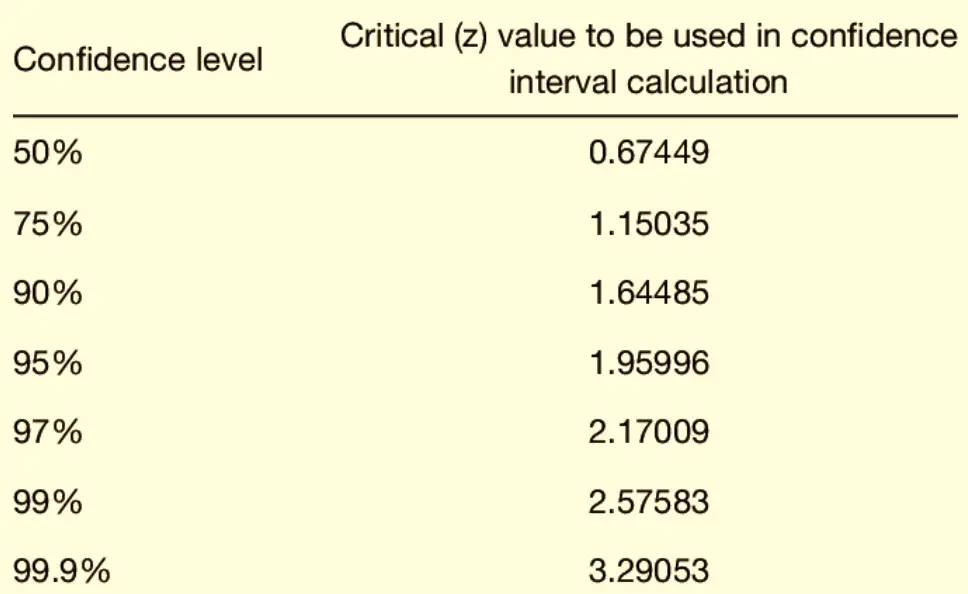
The selection of these critical values is directly linked to the significance level (often denoted as α) that the researcher or analyst has chosen. Commonly used significance levels include 0.05, 0.01, and 0.10.
The Mechanics of Critical Z-Values
To understand this concept better, let’s take the commonly used significance level of 0.05. If you’re conducting a two-tailed test (which means you’re considering extreme values on both ends of the distribution), you’d split this α into two, placing 0.025 in each tail. Using a Z-table or statistical software, you’d then identify the Z-values that correspond to these tail areas. For a significance level of 0.05, the critical Z-values are typically -1.96 and +1.96.
Critical Z-Values in Hypothesis Testing
Hypothesis testing is a methodological process where statisticians make an initial assumption (the null hypothesis) and test the validity of this assumption based on sample data.
The process typically follows these steps:
- State the Hypotheses: Formulate the null (Ho) and alternative hypotheses (Ha).
- Choose the Significance Level (α): Decide the threshold for rejecting the null hypothesis.
- Select the Test and Find the Critical Value(s): For a Z-test, this would be the critical Z-value.
- Compute the Test Statistic: Calculate the Z-score for your sample data.
- Make a Decision: If your test statistic falls within the critical region (beyond the critical Z-values), you’d reject the null hypothesis.
Examples and Applications
Example 1: Imagine a shoe manufacturer claims their shoes last an average of 365 days before showing significant wear. A competitor believes these shoes wear out faster and conducts a study with a sample of shoes. Using a significance level of 0.05 for a two-tailed test, the critical Z-values are -1.96 and +1.96. If the Z-score calculated from the sample data is -2.1 (indicating the shoes wore out faster than claimed), the null hypothesis would be rejected since -2.1 falls outside the critical values.
Example 2: A beverage company claims its juice box contains 250 ml of juice. A consumer group, suspecting the company overstates the quantity, tests a sample. Using a one-tailed test at α = 0.05 (because they only care if the juice box contains less than claimed), the critical Z-value for this test would be -1.645. If their sample calculation results in a Z-score of -1.8, the null hypothesis would be rejected, suggesting the juice boxes contain less than the stated amount.
Why Are Critical Z-Values Important?
Critical Z-values serve as gatekeepers. They provide the boundary beyond which the observed data is considered rare or unusual under the assumption that the null hypothesis is true. By setting these boundaries, statisticians have a clear framework to determine whether to reject the null hypothesis or fail to reject it.
Find out everything you need to know about standard deviation
Summary
Critical Z-values, while just numbers on the surface, are pivotal in hypothesis testing, guiding decisions and providing clarity. They act as the yardstick against which observed data is measured, helping determine the validity of initial assumptions. In a world drowning in data, tools like critical Z-values help sieve through the noise, enabling researchers, analysts, and professionals to draw significant, actionable insights. As the backbone of hypothesis testing, understanding and applying critical Z-values is indispensable for anyone seeking to make informed decisions based on data.
