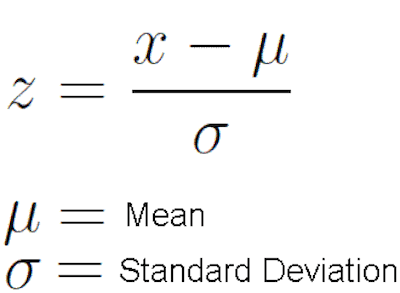
As you probably already know, we use Z scores when we want to transform a standard distribution into something that is easier for us to calculate probabilities on. After all, we want to determine the likelihood of a specific event to occur.
Learn everything you need to know about Z score.

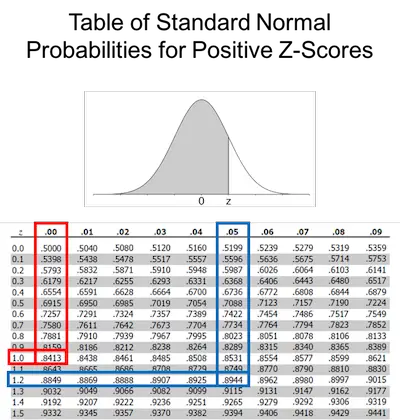
Since this is a very common transformation, we can use a reference chart that allows us yo lookup for the values – the Z table. Those values correlate to the value under the normal distribution curve. So, we use the Z table to find the percentage chance of a specific event to occur.
The Different Z Score Questions You Can Get

One of the things that we believe is important to keep in mind is that depending on the problem, you may be looking for different things. The truth is that there are 3 main types of Z score questions that you may be wondering about:
- The percentage chance of an event occurring beyond a certain point – This is the number under the curve beyond the Z value.
- The percentage chance of an event occurring under a certain point – This is the number under the curve up the Z value.
- The percentage chance of an event occurring between two points – In some circumstances, one of these points may be the mean or the center of the distribution. Notice that in this case, the Z scores are used to determine how far off a specific point in the distribution is from the mean.
In addition to this, you should also know that depending on the information that is provided in the problem, you may have 2 different ways to solve the questions asked. The first one is by using the Z table to find the Z score. The second one is by calculating the Z score itself.
These ar the most common probability distributions.
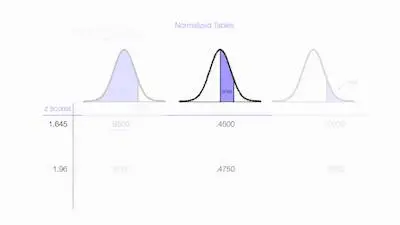
Understanding The Normalized Z Table

Simply put, the Z table is based on normal standard distribution and is used to solve how far off a point in the distribution is likely to be from the mean or center.
In case you don’t know, a common statistical way of standardizing data on one scale is a Z score. This means you can see it as a common yardstick for all types of data.
It is also important to notice that both z and t distributions are bell-shaped and symmetric, and they both have a mean of zero.
Check out some real applications of the Z score.
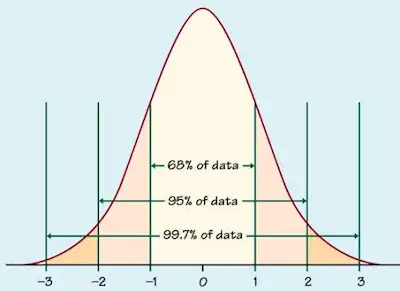
When you use the Z transformation, you are simply converting any normal distribution into a normal distribution with a mean of zero and a standard deviation of one. And this is all that you need to use a single normal table to find probabilities.
How To Use A Z Table To Find A Z Score

When you are looking to determine the Z score using a Z table, you need to pay attention to what side the Z should be on.
As soon as you have this figured out, you just need to ensure that you follow the next steps:
Learn more about the standard deviation.
Step #1: Pick the right Z row by reading down the right column.
Step #2: Read across the top to find the decimal space.
Step #3: Find the intersection and multiply by 100.
As you can easily understand, this means that 93.82% resides to the left of the normal curve just like 6.18% resides to the right of Z.
