
Simply put, the standard deviation is a measure that you use to see how your data is spread out around the average or mean. By using the standard deviation, you can easily see if the data is mostly near the average, more spread out, if it concentrates above or below the average, among others.

Representing Standard Deviation On A Graph
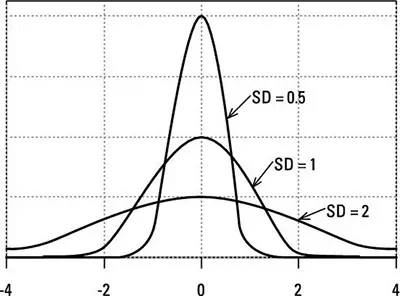
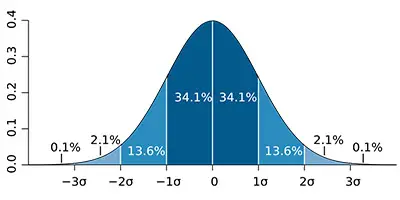
While when you have small data it may be easier for you to determine how the data is dispersed, this can’t be said when you are looking at bigger data. So, one of the tools that researchers and statisticians use is graphs, more specifically the Bell curve or the normal distribution as it is also known.
Looking to know more about the z score?
A Real-Life Example
One of the difficulties that may students experience when they are starting with statistics is that they have a hard time understanding how they are going to put all this knowledge into practice. So, there is nothing like seeing a real-life example so that you fully understand it and, hopefully, be able to identify others on your own.
There is a common statement that is made that says that most students get Cs while only a few get Fs and As. But is this true? While you could collect data from your school and put this exercise into practice, we can state that this statement is true. But how can you display it in an effective way?
Discover how to easily calculate the z score.
As we mentioned above, the best way is to use the Bell curve. In fact, besides grades, you can also use this graph to represent nutrition habits, people’s heights, people’s weighs, and even exercise routines that you want to examine deeply. While these representations may not look very useful for you, you need to know that businesses, governments, and even schools use this type of data and graphs not only to know where they stand at the time as well as to make predictions for the future. For example, let’s say that a college offers 4 different degrees but most students only apply for two of them. So, these schools are looking at their students’ numbers falling but they now understand what is happening. So, they can decide on either increasing the features and improving the publicity for the two degrees that have fewer students applying to, or they can decide to increase the vacancy numbers for the two degrees that have more students.
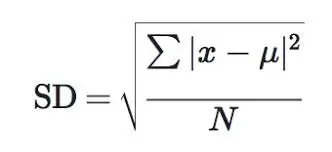
Calculating The Standard Deviation By Hand
Notice that while you may have already used a software to calculate standard deviations, we believe that it is important that you know how to make them by hand. This way, you will understand the ropes of how it is determined and it will be easier for you to conclude something about the results that you get.
So, to determine the standard deviation by hand, just follow the next steps:
Step #1: Discover The Variance:
The variance represents how close or how far the data in your sample is from the mean. One of the things to retain is that the lower the variance the more the data is concentrated near the mean. On the other hand, the higher the variance, the more the data is spread far from the mean.
Let’s say that you are measuring trees and that their heights are as follow: 7, 8, 8, 7.5, and 9 feet. With this data, it is easy to see that the mean is 7.9.
Learn how to calculate the z score using Excel.
So, to determine the variance, you will need to subtract the tree height by the mean:
7 – 7.9 = -0.9
8 – 7.9 = 0.1
8 – 7.9 = 0.1
7.5 – 7.9 = -0.4
9 – 7.9 = 1.1
Step #2: Take The Square Root Of The Variance:
In our simple example of the tree heights, you would have to make the following calculations:
(-0.9)^2 = 0.81
(0.1)^2 = 0.01
(0.1)^2 = 0.01
(-0.4)^2 = 0.16
(1.1)^2 = 1.21
Step #3: Sum The Squared Numbers:
0.81 + 0.01 + 0.01 + 0.16 + 1.21 = 2.2
And now, you ill need to divide the sum of squares by (n-1). Considering that we were looking at 5 trees, n-1 = 4. So:
2.2 / 4 = 0.55
0.55 is the variance for this sample of tree heights.
Learn more about the standard deviation here.
Step #4: Take The Square Root Of The Variance:
Now, to determine the standard deviation, you will need to:
√0.55 = 0.741619848709566
In this case, you should always round your number to the second or third decimal. So, the standard deviation in our sample of tree heights is 0.74.