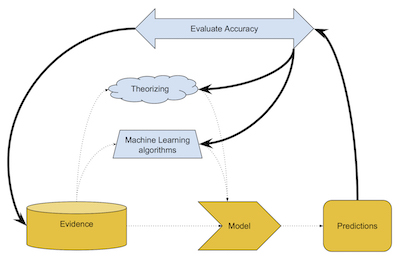
When you are learning statistics, then you may not have the idea that actually teaching how to do accurate statistical model building is one of the most difficult tasks. The truth is that when you are learning how to do an accurate statistical model building, you will notice that this is a process that is difficult to divide into steps. And even if you can, you need to, at each step. evaluate the situation and make decisions on the next step.
Take a look at our Z-score calculator.

The reality is that you shouldn’t run into difficulties when you are looking at predictive models when the relationships between the variables aren’t a concern. In this situation, you can simply run a regression model. However, when you are trying to establish the relationships between variables, then you may struggle a bit. So, make sure that you take a look at the following guidelines on how to do an accurate statistical model building.
6 Guidelines For Accurate Statistical Model Building
#1: Keep In Mind That Regression Coefficients Are Marginal Results:
So, simply put, you just need to remember that the coefficient for each predictor is the unique effect that this same predictor has on the response variable. Ultimately, it is the effect after controlling for other variables in the model.
Discover what to do when you can’t run an ideal analysis.
#2: Begin With Univariate Descriptives And Graphs:

No matter what data you are running, it is extremely important that you always start with descriptive analysis. After all, this is extremely handy to find errors that you may have missed during cleaning. Besides, you should take a moment for graphs as well. The reality is that you shouldn’t only be looking for bell curves. You should also be looking for interesting breaks in the middle of the distribution. From values that are much higher or with less variation than you expected to values with a huge number of points.
#3: Run Bivariate Descriptives Including Graphs:
Again, charts may be extremely helpful especially scatterplots. The reality is that you need to try to understand how each potential predictor relates not only on its own but also to every other predictor and to the outcome as well.
What is statistical significance?
#4: Place Predictors Into Perspective:

One of the best things that you can consider doing is to set up your predictors into perspective or in sets if you prefer. This is a helpful way to see how related variables work together as well as to see what happens to them once you put them together.
One of the things that you may not know is that in most cases, the variables within a set are correlated. However, when you put them all at once, you may have a hard time discovering their relationships.
These are the most common probability distributions.
#5: Model Building And Interpreting Results Go Hand-In-Hand:

When you run a model, you get a story. So, you just need to listen to it. This way, you will be able to make better decisions on the next model that you have to run.
#6: A Variable Involved In An Interaction Must be In The Model By Itself:
Finally, it is usually a good idea to simply eliminate non-significant interactions. On the other hand, when you find significant interactions, you have got to maintain them.
