
There’s no question that some parts of running models are easier than others. And when talking about complexity or difficulty, we have to mention the effect size when you are calculating sample size estimates.
One of the things that you may not know is that the power of every significance test is based on four things: the alpha level, the size of the effect, the amount of variation in the data, and the sample size.
Discover how you can use z score tables.
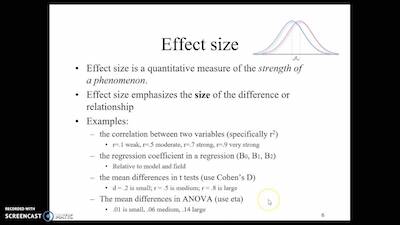
The truth is that the effect size in question needs to be measured in a different way, depending on the statistical test that you are conducting. It could be a mean difference, a difference in proportions, a correlation, regression slope, odds ratio, etc.
Notice that when you need to study and estimate the sample size needed for a specific power, you usually can’t change the alpha level. If you think about it, it is usually set at 0.05 for most purposes. Besides, you can lower the amount of variation by changing the design of the study or including a key covariate, if one is available.
Looking to know more about descriptive analysis?
In what concerns the effects on the effect size, you all you can do is to measure the variables with as little error as possible. And this is why we solve for sample size.
As a rule of thumb, even the tiniest effect size cane be found statistically significant with a large enough sample. But while this seems ok, the truth is that you don’t want to make any claims that an effect exists even if it’s tiny. So, just keep in mind that good power calculations are based on the smallest effect that is scientifically or clinically meaningful.
Discover how to apply the z score in real life.
Why Is It Hard To Find The Effect Size?
The truth is that choosing the smallest scientifically meaningful effect may be very difficult to figure out before out. And there are two main reasons. The first is the fact that some scales are pretty meaningless. Effects that are measured in degrees Celsius, hours, or currencies are usually easy for you to understand since they are meaningful and concrete. However, you need to think about what the general public actually understands and what find meaningful. For example, the general public may not realize that a rise in 0.5 degrees Celsius in the temperature of a soil core under experimental conditions is meaningful.
And this is why it’s the one step that you need to take on your own without any help. After all, it’s on those scales that are abstract and lack inherent meaning and that haven’t been used much for which the smallest meaningful effect size is difficult to define.
The second reason because it’s hard to determine the effect size is related to the fact that it needs to make sense to you.
Get a complete grasp about the z score, z table, and z distributions.
Bottom Line
Depending on how you define and think about your effect, it can be tricky to translate it to the effect size the software wants you to input.
And once you estimate sample sizes, remember they’re just estimates. They’re only as good as the information they’re based on. If you have to guess a bit here and there, don’t take them too seriously.