
It is normal that when you are studying statistics, you want to compare different groups to see if there are differences. Well, in order to do so, you need to use variance analysis.
Learn everything you need about z score tables.
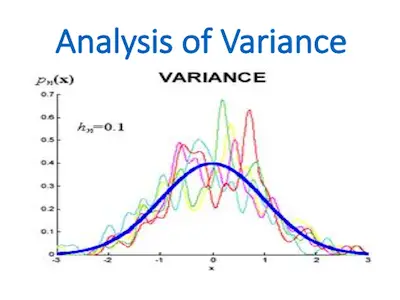
Looking At The Variance Analysis Basics
As we already mentioned above, variance analysis involves comparing what is expected and what is actually observed. After all, if you recall, the variance is the difference between the observed values and the model values.
So, when you have univariate data, your models will be the measures of central tendency. On the other hand, in the case of simple correlations or bivariate data, this would mean that the difference between the line of best fit and the actual values measured.
However, it’s important to consider that in the case of multivariate data, which is three of more variables, the challenge increase. This is because you are comparing an empirical model to a theoretical model. So, as you can easily understand, the easiest way to do this is to compare groups to an outcome. But the number of groups and variables determines the best method to use.
Comparing Two Groups
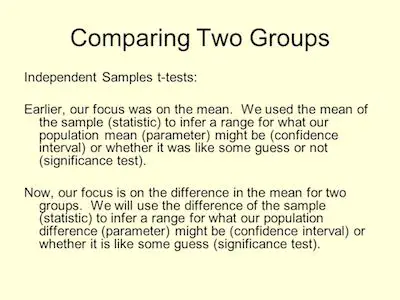
Comparing two groups to a single outcome is the simplest thing you can do. In this case, you need to use the t-test that compares the same outcome for two groups. The main benefit of using the t test is that you can do it in two different ways:
- A Dependent T-Test: Compares the same outcome for 2 groups with the same participants. This is usually the one you should pick for before and after scenarios.
- An Independent T-Test: Compares 2 groups based on the same outcome. This is the type of test that is more common in experimental studies.
Discover what to do when you can’t run the ideal analysis.
Comparing Multiple Groups
One of the great things about statistics is that you have numerous ways to look at your data. So, as you can imagine, in statistics, you can also compare 3 or more groups. While it takes more time, it is certainly useful.
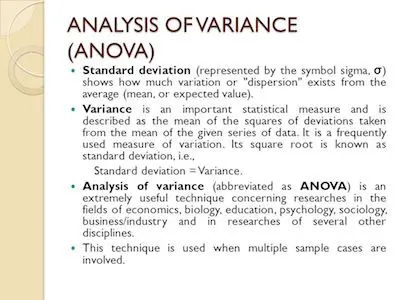
While you could use t tests, the truth is that they’re not the best option. After all, each t-test has error associated with it, so doing multiple t-tests only increases the amount of error. Instead, you need to use the special technique, analysis of variance or ANOVA.
Discover everything you need to know about statistical significance.
Analysis Of Variance (ANOVA)
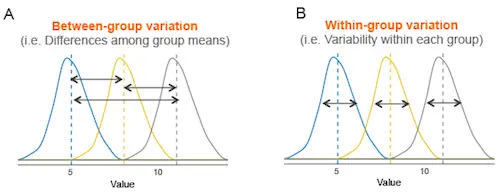
When you are using this method, instead of analyzing the variance of 2 groups, you will be analyzing the variance and the error that occurs in a group or between groups. So, we can then state that it compares the groups in the context of a single outcome.
You need to keep in mind that you will analyze the variance using the F ratio which is the ratio of the error variance between the groups compared to the error variance within the group.
Just like the t-test, the F-ratio compares actual values to a distribution values that helps to determine significance. In this way, you can see if there is a significant difference between the groups.
Notice that the F-test only reveals if there is a significant difference. It does not determine which group is different nor how it is different. For that, you need post hoc tests.