
Overall speaking, a statistician needs to determine if a pattern he identified in the data is significantly different from no pattern at all. As you already know, there are many different ways to do this. However, the most common one involves using probability functions.
Discover everything you need to know about the Z table.
The reality is that a probability function allows you to determine the chance that your model is different. Between the different probability functions, the most popular one is the F distribution.
What is The F Distribution?
The first thing you need to know about the F distribution is that it follows the normal distribution. Besides, the F distribution is a skewed distribution of probabilities similar to a chi-squared distribution. However, there is a major difference here. While the chi-squared distribution deals with the degree of freedom with one set of variables, the F-distribution deals with multiple levels of events having different degrees of freedom. So, this means that there are several versions of the F-distribution for differing levels of degrees of freedom.
What is statistical significance?
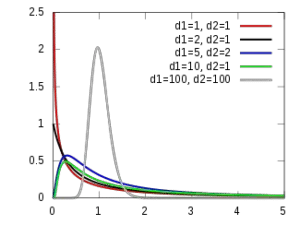
Each curve represents different degrees of freedom. So, the area required for the test to be significant is different. In case you don’t know, the actual equation for the F-distribution curve is:
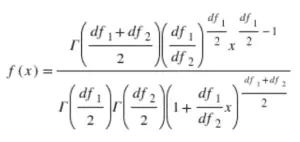
As you can see, the degrees of freedom are in the equation. So, this means that it is easy to see that as the degrees of freedom change, the curve changes as well.
Understanding the standard deviation.
When You Should Use The F Distribution
The truth is that it is pretty unlikely that you need to be the one constructing an actual curve. In most cases, you will have a software that will do it for you. Nevertheless, you will still need to use the curve concept in some experimental setups.
Simply put, the F test compares multiple levels of independent variables with multiple groups. You can find this in ANOVA and factorial ANOVA.
Imagine that you’re testing a new drug for heart disease named X. In this case, your goal is to determine the significant effects of different dosages. So, you will set up different trials – 0 mg, 50 mg, and 100 mg of X in three randomly selected groups of 30 each. This is a case for ANOVA, which utilizes the F-distribution.
How To Use The F Distribution
As you probably already figured out, the F distribution is used for the F test.
Simply put, the F-test involves calculating an F-score based on the variances of the three (or more) levels that you are testing compared to the sample size.
Here’s the equation for the actual F-score:

As you can see, it compares the variance within a group to the variance between the groups. Then, when you run the equation, you get the F score.
Discover what to do when you can’t run the ideal analysis.
To determine if this value is high enough to be significant, you compare it to an F-distribution table.
You basically find the value at which your degrees of freedom intersect. If your calculated value is higher than the value in the table, then your samples are significantly different. If the calculated value is lower, then the groups are not different enough to be significant.