
Explore the significance of the F-distribution table in statistical analysis. Learn how to interpret critical values and make informed decisions.
Look up critical values for F distribution.
The F-distribution table is a valuable tool in statistics for understanding the F-distribution and making inferences about data. In this comprehensive guide, we will explore the F-distribution, its properties, and how to use the F-distribution table effectively. Whether you’re a student, researcher, or data analyst, understanding the F-distribution and its associated table is essential for conducting hypothesis tests, analyzing variance, and making informed decisions. Let’s delve into the world of the F-distribution and unlock its power.
1. Introduction to the F-Distribution
What is the F-Distribution?
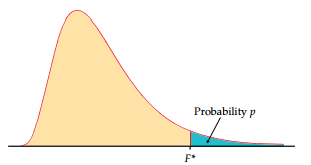
The F-distribution, named after its founder Sir Ronald Fisher, is a probability distribution that arises in statistical analysis. It is primarily used to compare variances between multiple groups or treatments. The shape of the F-distribution depends on two parameters, the degrees of freedom of the numerator and the degrees of freedom of the denominator.
Properties of the F-Distribution
The F-distribution is positively skewed and has a range of values greater than or equal to zero. The shape of the F-distribution changes depending on the degrees of freedom. Understanding the properties of the F-distribution is crucial for interpreting the results obtained from hypothesis tests and analysis of variance (ANOVA).
2. Understanding Degrees of Freedom
Degrees of freedom play a significant role in the F-distribution and its table. In statistics, degrees of freedom represent the number of independent pieces of information available to estimate or calculate a parameter. For the F-distribution, there are two types of degrees of freedom: numerator and denominator. Understanding how degrees of freedom are calculated and their impact on the F-distribution is essential for using the F-distribution table correctly.
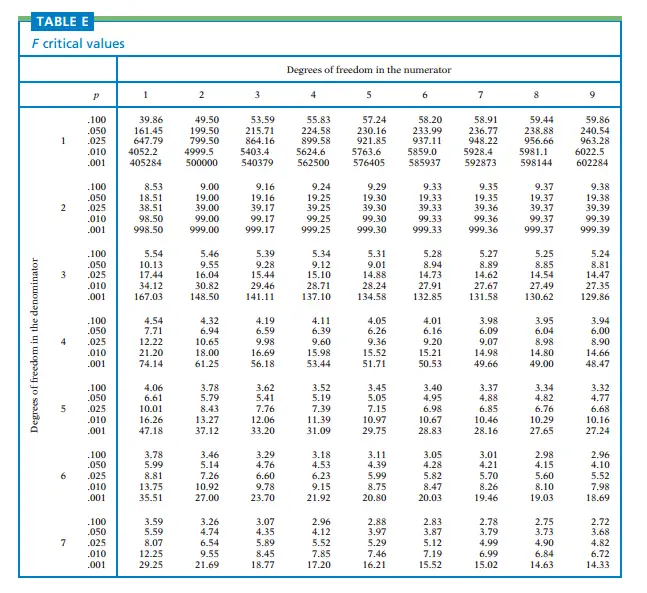
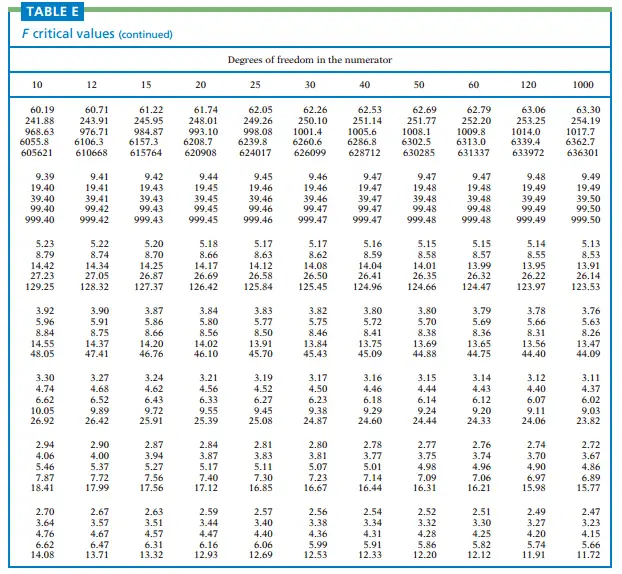
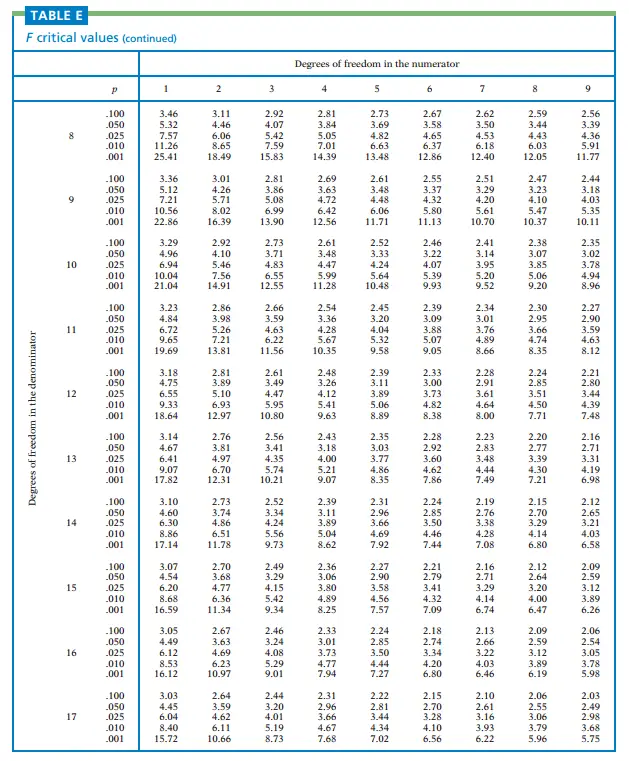
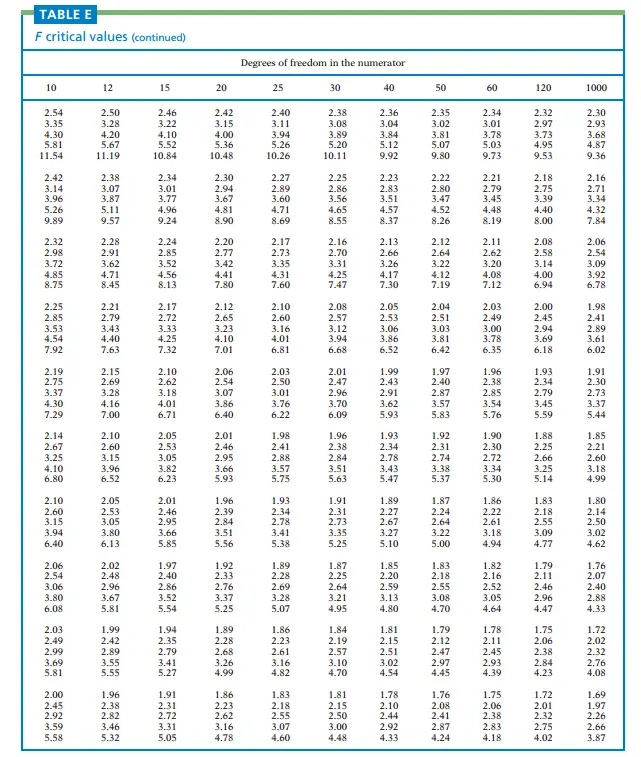
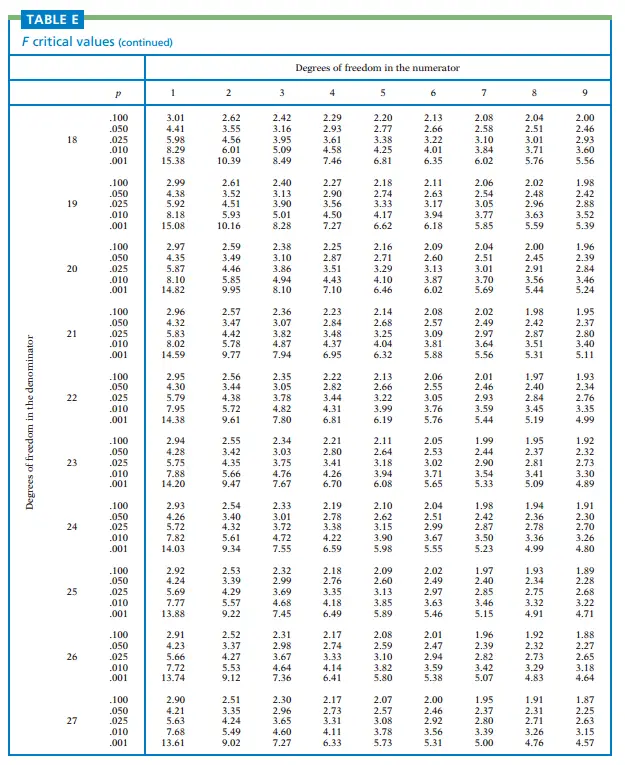
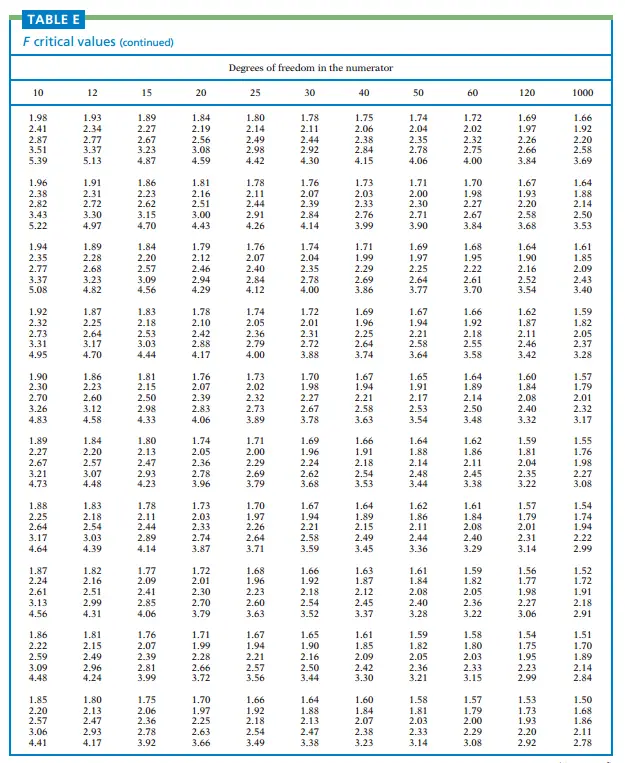
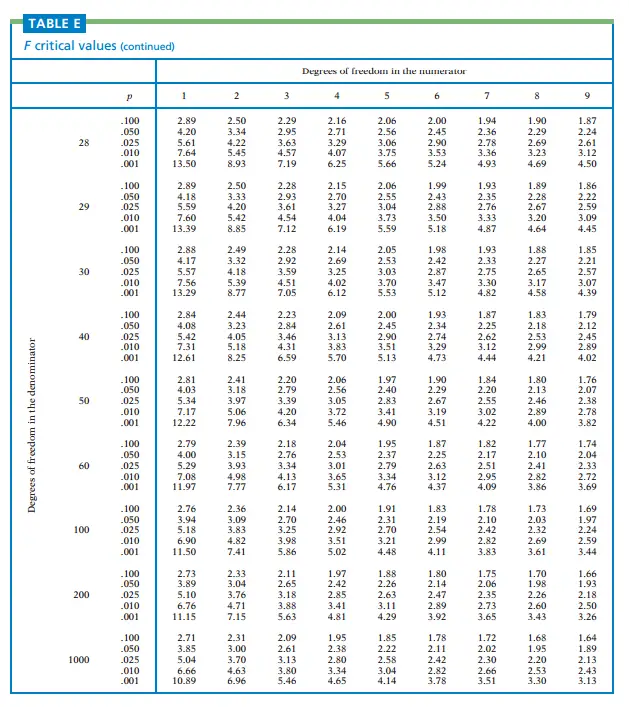
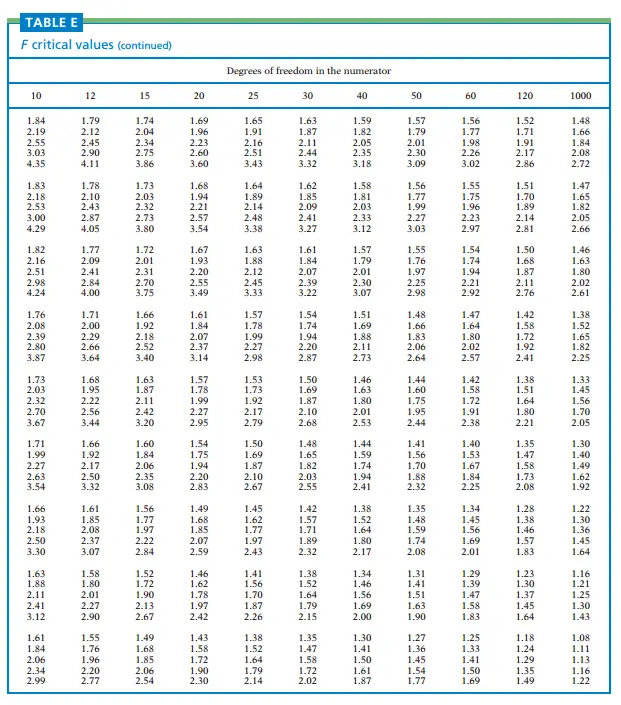
3. Purpose and Structure of the F-Distribution Table
The F-distribution table provides critical values or p-values for different degrees of freedom combinations. It allows statisticians and researchers to determine the level of significance and make decisions based on observed F-values. The structure of the F-distribution table typically includes rows representing the numerator degrees of freedom, columns representing the denominator degrees of freedom, and corresponding critical values or p-values.
4. How to Use the F-Distribution Table
Finding Critical Values
To find critical values using the F-distribution table, you need to identify the degrees of freedom for the numerator and the denominator. Locate the appropriate row and column in the table and find the corresponding critical value. These critical values are crucial in hypothesis testing and determining whether to reject or fail to reject the null hypothesis.
Calculating p-values
In addition to critical values, the F-distribution table can be used to calculate p-values. To find the p-value associated with an observed F-value, you locate the degrees of freedom in the table and determine the area under the F-distribution curve beyond the observed F-value. This p-value helps in assessing the strength of evidence against the null hypothesis.
5. Example Applications of the F-Distribution Table
The F-distribution table finds applications in various statistical analyses, including:
One-Way ANOVA
The F-distribution table is commonly used in one-way analysis of variance (ANOVA) to compare means between multiple groups. By comparing the calculated F-value to the critical value from the F-distribution table, you can determine whether there are significant differences among the group means.
Regression Analysis
In regression analysis, the F-distribution table is used to assess the overall significance of the model. The F-test compares the explained variance by the regression model to the unexplained variance. By examining the p-value associated with the F-value, you can determine if the regression model is statistically significant.
6. Limitations and Considerations
While the F-distribution table is a valuable tool, it is essential to consider its limitations. The F-distribution assumes certain assumptions, such as normality and independence, which may not always hold in real-world scenarios. Additionally, the F-distribution table is limited to specific degrees of freedom combinations, and extrapolation beyond those values may introduce inaccuracies.
7. Summary
The F-distribution table is an indispensable resource for statistical analysis, providing critical values and p-values for the F-distribution. By understanding its purpose, structure, and applications, you can effectively use the F-distribution table to make informed decisions and draw meaningful conclusions from your data. Whether you’re performing hypothesis tests, conducting ANOVA, or exploring regression analysis, the F-distribution table is your go-to reference. Embrace its power and elevate your statistical analysis to new heights.
By understanding the F-distribution and how to use the F-distribution table, you can unlock a world of statistical analysis possibilities. Gain confidence in your research, make informed decisions, and contribute to the field of statistics with the insights gained from the F-distribution table.