
Unlock the power of Chi-Square analysis with our comprehensive guide, including insights on the Chi-Square table and interpreting its values.
Look up a critical value for the chi-square distribution.
Introduction
Statistical analysis plays a crucial role in various fields, helping researchers draw meaningful conclusions from data. One powerful tool in statistical analysis is the Chi-Square test, which examines the association between categorical variables. To effectively use the Chi-Square test, researchers often rely on a Chi-Square table. In this blog post, we will delve into the Chi-Square table, exploring its significance, structure, and how to interpret the values it provides.
Understanding the Chi-Square Test
Before we dive into the Chi-Square table, let’s briefly review the Chi-Square test itself. The Chi-Square test is used to determine if there is a significant association between two categorical variables. It compares the observed frequencies in a dataset with the frequencies we would expect if there were no association. The test produces a Chi-Square statistic and a corresponding p-value, which indicates the level of significance.
Structure of the Chi-Square Table
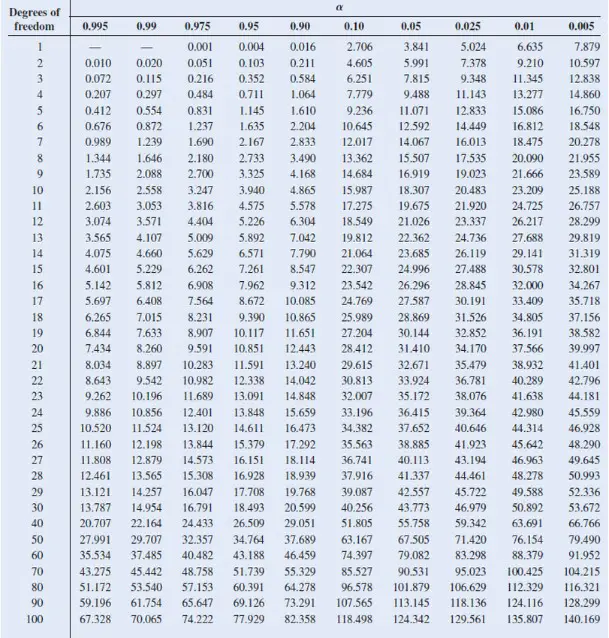
The Chi-Square table, also known as the Chi-Square distribution table, is a reference table that provides critical values for different degrees of freedom and significance levels. The table is organized in rows and columns, with each row representing the degrees of freedom and each column representing a specific level of significance. The values in the table correspond to the critical Chi-Square statistic needed to reject the null hypothesis at a given level of significance.
Interpreting the Chi-Square Table
To effectively use the Chi-Square table, you need to know the degrees of freedom (df) and the desired significance level. The degrees of freedom depend on the number of categories in each variable. Once you identify the appropriate row and column in the table, you can locate the critical Chi-Square value.
For example, let’s say you have a Chi-Square statistic of 10.21 with 3 degrees of freedom and want to determine its significance at the 0.05 level. By locating the row with 3 degrees of freedom and the column for 0.05 significance, you find the critical Chi-Square value of 7.815. Since the calculated Chi-Square statistic (10.21) exceeds the critical value (7.815), you can reject the null hypothesis and conclude that there is a significant association between the variables.
Check out our Z-Score Calculator
Limitations and Considerations
While the Chi-Square table is a valuable tool, it’s important to note its limitations and considerations. The Chi-Square test assumes certain conditions, such as independent observations and expected cell frequencies greater than 5. Violating these assumptions can lead to inaccurate results. Additionally, the Chi-Square test only determines if there is an association between variables; it does not provide information about the strength or direction of the association.
Summary
The Chi-Square table is an essential resource for researchers and statisticians utilizing the Chi-Square test. It allows for the interpretation of the Chi-Square statistic in terms of significance, helping draw conclusions about the association between categorical variables. Understanding the structure of the table and how to locate critical values is crucial for accurate analysis. By harnessing the power of the Chi-Square test and the information provided by the Chi-Square table, researchers can make informed decisions and contribute to the advancement of knowledge in their respective fields.