
In statistics, a confidence interval refers to the probability of a population parameter fall between a set of values for a certain proportion of times.
Generally speaking, a confidence interval measures the degree of certainty or uncertainty in a sampling method.
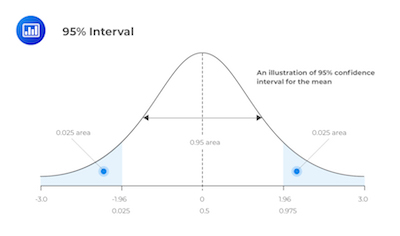
Notice that they can take any number of probability limits. However, the most common ones are 95% and 99%.
Understanding A Confidence Interval
Simply put, statisticians use a confidence interval when they want to measure uncertainty in a sample variable. Let’s say that a researcher chooses different samples randomly from the same population. He then needs to compute a confidence interval for each sample to see how it may represent the true value of the population variable.
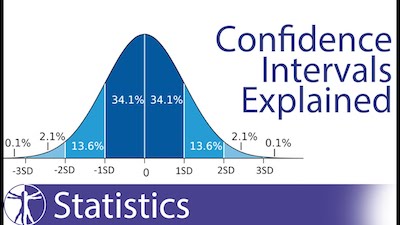
One of the things you need to keep in mind is that a confidence interval is a range of values that are bounded both above and below the mean. So, we then state that it refers to the percentage of probability or certainty that the confidence interval would contain the true population parameter when you draw a random sample many times.
How To Calculate A Confidence Interval
Imagine that a group of researchers is studying the heights of college basketball players. They take a random sample from the population and establish 74 inches as the mean height.
Notice that the average of 74 inches on its own is of limited use since it doesn’t reveal the uncertainty linked with the estimate. So, you are missing the degree of uncertainty.
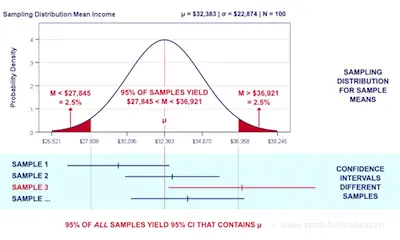
Ultimately, confidence intervals do provide more information than simple point estimates. When you establish a 95% confidence interval using the sample’s mean and standard deviation, and assuming a normal distribution as represented by the bell curve, the researchers arrive at an upper and lower bound that contains the true mean 95% of the time.
Getting back to our example, imagine that the interval is between 72 inches and 76 inches. If the researchers take 100 random samples from the population of college basketball players as a whole, the mean should fall between 72 and 76 inches in 95 of those samples.
Understanding the F distribution.
Examples Of A Confidence Interval
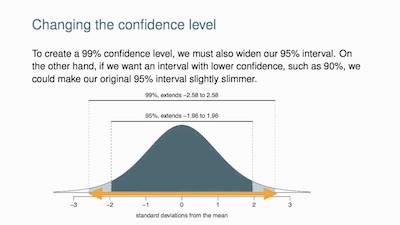
It’s always important for a researcher to look at the confidence interval. After all, when a researcher wants more confidence, he can simply expand the interval to 99%, for example. When he does this, he is basically creating more room for a greater number of sample means. So, in our example, if they establish a 99% confidence interval as being between 70 inches and 78 inches, they can then expect to have 99 out of 100 samples evaluated to contain a mean value between these numbers.
Discover what to do when you can’t run the ideal analysis.
On the other hand, if they were using a 90% confidence interval, this would mean that they could only expect 90% of the interval estimates to include the population parameter.
One of the things that is important to retain about confidence intervals is that they don’t represent a percentage of data from a given sample that falls between the upper and lower bounds.