
One of the first questions that most tend to hear when they are learning about probability and statistics is how likely are you to flip a coin and it lands on its edge?
As you can imagine, this lands in the land of probability and statistics.
Find all the z score values you need.
What Is Probability?
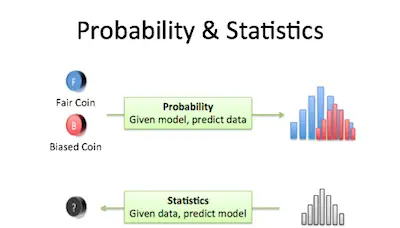
Simply put, the probability of something is the likelihood of that something to occur. This something, in statistics, is called event or happening.
Let’s take a look at some examples so you understand the concept completely.
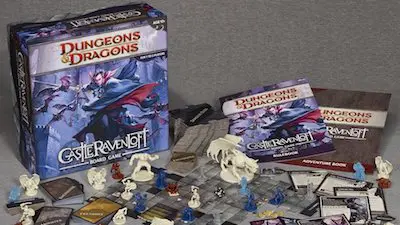
When you are playing the Dungeons & Dragons game and you need to roll a D20, then you know that getting a 20 is a very good thing most of the time. While everyone says it is incredibly difficult to get a 20, the truth is that it is as difficult to get a 20 as it is to get a 1. But why?
What is descriptive statistics?
As we mentioned above, when you are trying to determine the probability (P), this means that you are trying to discover the chance of an event to occur, which is usually written as P(event).
So, in the case of our D&D dice when you roll it you have these outcomes
S = {1, 2, 3, 4, 5, 6, 7, 8, 9, 10, 11, 12, 13, 14, 15, 16, 17, 18, 19, 20}
This means that the likelihood of rolling a number 1 – 20 is 100% while the likelihood of rolling a 21 is 0%. But the events in between are a little different.
Probability is calculated as the total number of desired outcomes ÷ total number of possible outcomes.
Discover the most common probability distributions.
Taking A Deeper Look At Our Example
We can say that there are 20 total possible events that can happen when you roll a D20. At this point, we’re only interested in getting one outcome – 20. Since it is one of 20 possible outcomes:
P(20) = 1/20 = 0.05
It has the same likelihood of a 1 being rolled:
P(1) = 1/20 = 0.05.
But if you want to roll a number less than 20 is different. After all, this would be:
P(1, 2, 3, 4, 5, 6, 7, 8, 9, 10, 11, 12, 13, 14, 15, 16, 17, 18, 19) = 19/20 = 0.95
We can then say that it is much more likely.
Summing up, rolling a D20 and getting a 20 is just as likely as rolling a 1. However, the reason 20s are so rare is that you are much more likely to roll a number less than 20.
Learn how to apply the z score in real life.
Statistics
So, how can you adapt probability to statistics which is all that matters to us?
Simply put, statistics is just the application of the laws of probability to real data. If you take the D20 example, this would be when you roll the dice 20 times and collect some data.
When you apply probability to real data, you are trying to determine if the outcome is significantly different from a model that we are generating. For example, the P(20) = 0.05.
Le’s take a closer look at this.
When you gather your data, you know there are different ways to describe it. The most usual ones are mean, median, and mode. In the case of statistics, you want to see if your actual data conforms to the model. To do this, you have two different options: the classical inference and Bayesian inference.
While classical inference deals with data that have a fixed probability based on the number of cases and events, the Bayesian inference deals with data whose probability is not fixed. That is, the probability is subject to change based on other factors.