
When you first start learning statistics, one of the first concepts that you will learn is the simple regression.
The reality is that when you have data, it simply begs to be analyzed. After all, this is how you can find patterns. On most occasions, you will need to start with a graph and some type of linear regression. But when you finally have the equation, then it’s time to move onto the simple regression analysis.
Make sure to use our z-score calculator.
Understanding The Simple Regression Analysis
Simply put, simple regression analysis refers to the interpretation and use of the regression equation. So, in case you don’t remember, this is the regression equation:
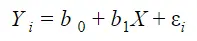
Where,
Yi = the dependent variable which is the outcome or effect that you are interested in.
Xi = the independent variable which is the variable that you believe predicts the outcome.
b1 = the relationship between the independent and the dependent variables.
b0 = means that if the independent variable is equal to zero, then the dependent variable will be equal to b0.
εi = the term of error or, as it is also called, the range of wrongness linked with your equation.
Putting The Formula To Work
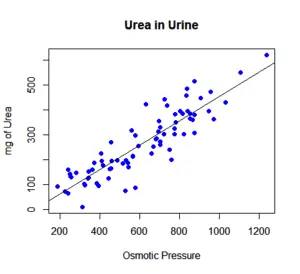
As you can see in the image above, there is a line and a lot of dots around it. Ultimately, each one of the dots you see represents a data point with an independent and dependent value.
Understanding the normal distribution.
The line is drawn by solving the following equation:
It’s important to notice that this line rarely is a perfect fit for all the data you have. In case it was, then we can then state that all data points were able to form the line by themselves.
Simple Regression Analysis Conclusions
One of the things that you need to keep in mind when you calculate the regression analysis for your data set is that you need to also calculate the correlation coefficient.
Notice that the correlation coefficient always has a value between -1 and +1 and it represents the strength of the regression equation to predict the outcome.
The closer the correlation coefficient is to 1 (either negative or positive), the stronger the relationship, with 1 being a perfect prediction. The formula is:
Notice that the correlation coefficient isn’t the same as the coefficient of determination. Simply put, this last one is more explanatory. After all, it can tell you how much of the variability in the outcome is due to the variability in the predictor.
Learn how to calculate sample size estimates.
When you have a high coefficient of determination, this means that most of the variance of the model can be explained by the dependent and independent variables. On the other hand, when you have a low coefficient of determination, it means that there is a lot of variance that the model can’t explain on its own.
Discover more about fixed vs random factors in mixed moldes.
Bottom Line
As you can see, it’s not difficult to understand the simple regression analysis concept. This is because it is one of the first statistic concepts that you will learn when studying statistics.