
In case you just started taking statistics classes, then you may be feeling a bit overwhelmed. After all, there are so many different concepts, notations, and even vocabulary.
The reality is that good statistics teachers try to teach these basic concepts with time to ensure that students can easily understand them. However, in the school environment, sometimes time is scarce. So, they need to rush to teaching new things. In addition to this, students should also be allowed to have time to practice these new concepts and ideas.

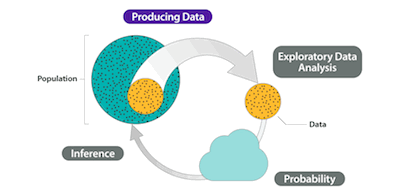
Looking to know more about the z score and the z tables?
One of the things that you need to keep in mind about statistics and the things that come in your manual is that they are oversimplified. Overall, when you need to work with real data, you will see that it can be very messy.
So, to ensure that you get a good grasp of statistics, especially if you just started your classes, make sure that you keep reading.
3 Statistical Analysis Rules That You Should Forget About When Dealing With Real Data
When you need to check statistical assumptions, just run a test. In this case, this will allow you to determine if the assumption is met by the significance of that test.
The reality is that every statistical model and test has assumptions. And even though they are important, sometimes they can be difficult to verify.
One of the things that you should keep in mind is that for many assumptions, there are specific tests whose goal is to test if the assumption of another test is being met. However, in most cases, these tests can help you but they aren’t definitive.
So, instead of doing this, you can:
#1: You should use the test results as just one of the many pieces of information that you can use together to decide if an assumption is violated.

So, just delete outliers that are 3 or more standard deviations from the mean. As you will be able to see, your data will look a lot better. And while when you have evidence that there is an error you can’t use this strategy, it can help in some situations. All you need to keep in mind is to not always follow this rule since you may be introducing bias into your results or you may be missing out on the most interesting part of your data set.
#2: When you discover an outlier, you should investigate it properly.
When this happens, you should try to find out if this is an error. Besides, you should try to discover where it comes from. The best thing to do in these cases is to check the normality of the dependent variables before you run a linear model.
As you probably already know, in a t test, there is the assumption that the dependent variable is normally distributed within each group. And this is the same thing as saying that given the group as defined by X, Y follows a normal distribution.
ANOVA also has a similar assumption: given the group as defined by X, Y follows a normal distribution.
But here’s the thing: the distribution of Y as a whole doesn’t have to be normal. In fact, if X has a big effect, the distribution of Y, across all values of X, will often be skewed or bimodal or just a big old mess. This happens even if the distribution of Y, at each value of X, is perfectly normal.
How can you calculate the z score?
#3: Another thing you can do is to simply check the assumptions after you have picked the predictors. After all, normality depends on which independent variables are in the model.