
When you are analyzing data or running an experiment, you want to ensure that your findings are “significant”. However, it is important to keep in mind that business relevance is different from confidence since a result isn’t only due to chance.
Discover more about the Z score and the Z table.
The truth is that, unfortunately, statistical significance is a lot of times not only misuses as it is also misunderstood in organizations today. And since more and more companies rely on data to make critical business decisions, we believe that it is crucial that you understand the concept of statistical significance.
What Is Statistical Significance?
Simply put, statistical significance helps you quantify if a result is likely due to chance or to some factor of interest. When you get a finding that is significant, this means that you feel confident that it is real and no that you were lucky in choosing the sample.
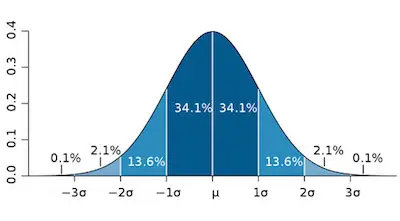
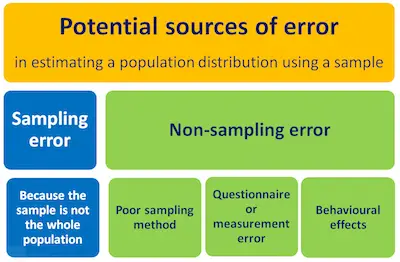
Whenever you conduct a survey, run an experiment, analyze a set of data or run a poll, you’re simply taking a sample of some population of interest but not looking at every single data point that you can. So, this may lead to sampling error which is something that you must contend with in any test that does not include the entire population of interest.

Learn more about the standard deviation.
One of the things that you should keep in mind is that there are two main contributors to sampling error: the size of the sample and the variation in the underlying population.
In what concerns the size of the sample, the bigger the sample sizes, the less likely it is to get results that reflect randomness. However, understanding the variation in the underlying population may be a bit trickier to spot. The reality is that you should develop a sense for it. Nevertheless, and above all, you should remember that the greater the variation in the underlying population, the larger the sampling error.
Evaluating Significance
The truth is that no matter what you are studying, the process of evaluating is the same all the time, After all, you will need to start by stating the null hypothesis as well as the alternative hypothesis. Besides, you should also define a target significance level.
Different applications of the Z score in real life.
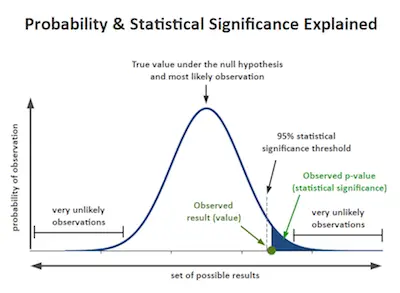
In case you don’t know, the significance level is an expression of how rare your results are, under the assumption that the null hypothesis is true. It is usually expressed as a “p-value,” and the lower the p-value, the less likely the results are due purely to chance.
The truth is that setting a target and then interpreting p-values can be very complex. After all, it tends to depend on what you are analyzing.
These are the most common probability distributions.
As you collect your data, you will then need to plot the results and calculate statistics. This includes the calculation of the p-value which incorporates the sample size and variation.
If you get a p-value lower than your target, then you reject the null hypothesis in favor of the alternative. Again, this means the probability is small that your results were due solely to chance.